
When a down metric helps you understand your product
A product manager's guide to root cause analysis

There are some days as a PM, you walk into the office a key metric is down and it’s an immediate fire drill to understand why 🔥. These “drop everything and figure it out” moments are part of what I love about being a PM - it’s always an adventure!
Root cause analysis, as this work is called, is a key part of being a product manager. I believe these analyses help PMs better understand their products. In this post I’m going to share a story from 2 and a half years ago of a root cause analysis I worked on when I first joined PagerDuty (all numbers either fake or obscured) and provide a guide for you to use for your own root cause analysis.
I joined the PagerDuty Growth team in September 2022 and our north star metric (Note: see last week’s post on Finding Your North Star) was 30 day conversion rate (the % of customers who started a free trial 30 days ago that converted to paid accounts). Soon after I joined my manager presented me with a problem - conversion rates had been declining for the last 3 months and we needed to figure out why.
Step 1: Gather Context
The first step in a root cause analysis is to understand more about the problem, asking questions to ensure you have all the background information you need to develop hypotheses.
For me, being brand new to the company and team here were a few questions I asked my manager:
Can you confirm the free trial flows? (I was still so new!)
Can you put me in touch with people from Marketing and Data Analysis to talk with?
Step 2: Exploring Hypotheses
Here’s the fun part, where you put on your detective hat and begin exploring hypotheses. When I begin this stage I like to create a document to record everything I’ve learned so that I can eliminate possibilities and build on others.
Here’s a table for how I structure the questions I explore:
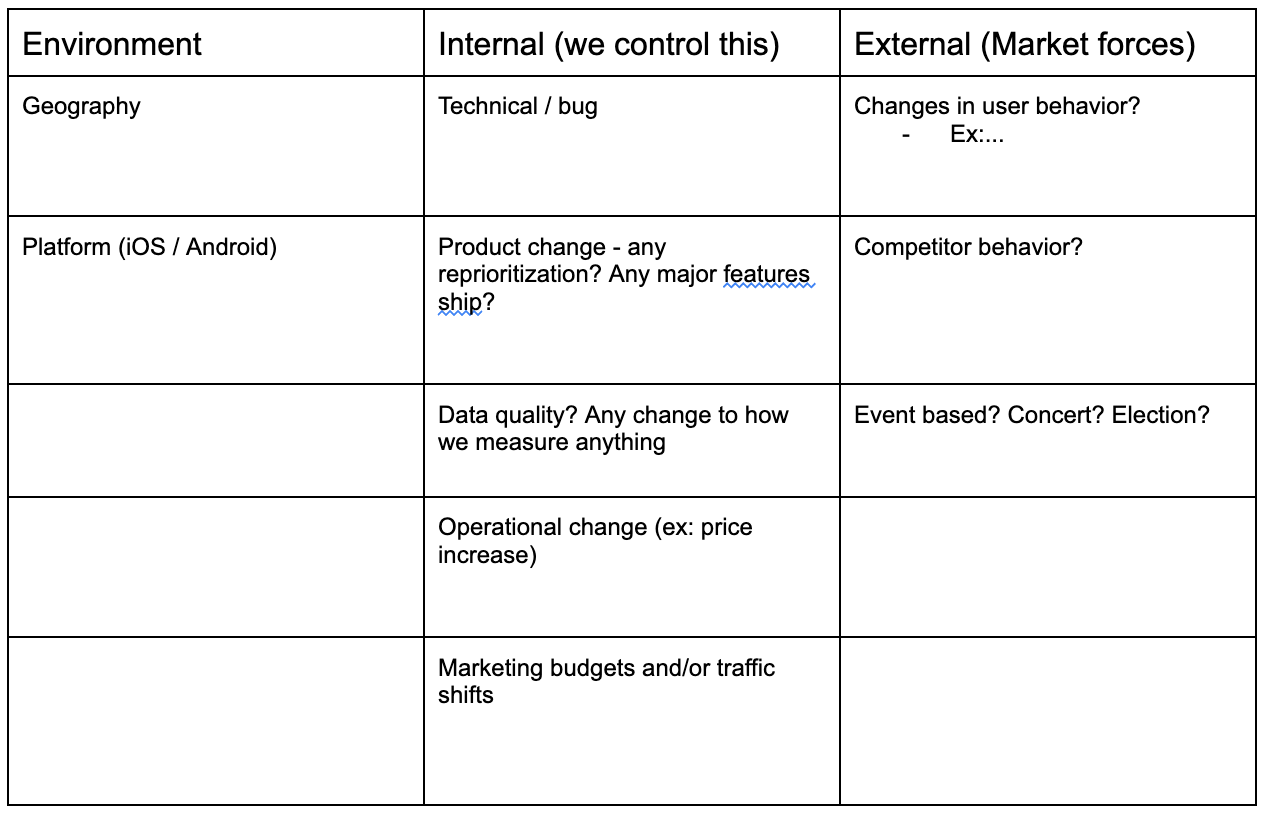
In the case of the conversion decline I began working through the questions, starting with the Environment category. Here I discovered that the free trial was predominantly used on web and was not available in PagerDuty’s mobile app and infrequently accessed via mobile web. In terms of Geography, I discovered that the decline is global and was not isolated to a specific geography. Environmental category eliminated.
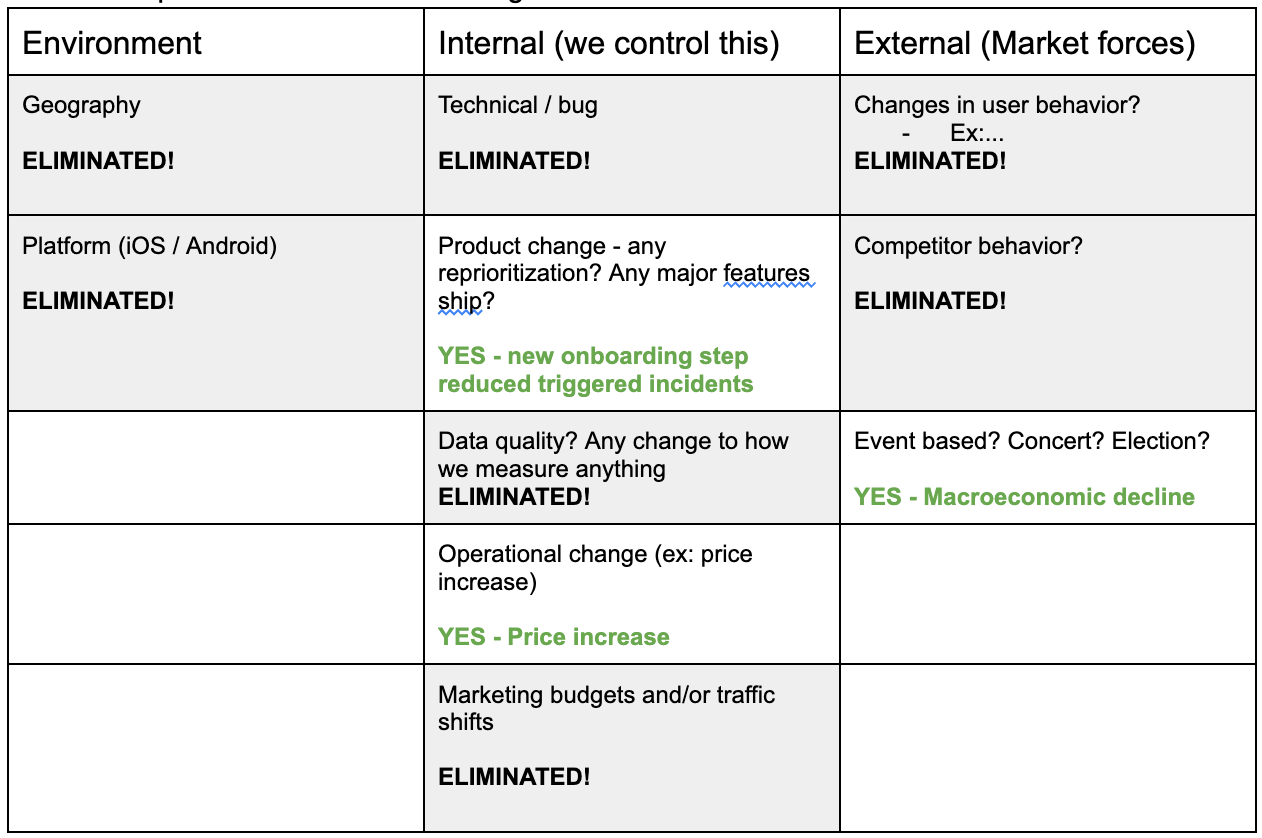
Next, I began examining possible Internal reasons and uncovered a few clues. While I was able to eliminate bugs, data quality and a change in marketing budgets or traffic patterns, there were product and operational changes that had occurred. A price increase was implemented in April, just before the decline started. Additionally, a product change occurred in August that made a key action - triggering a test incident - became harder for customers. Digging into the impact of test incidents on conversion rates I found that trials that do not trigger an incident convert significantly worse. Another clue.
While I already had two clues, I also took a look at External factors. One major change in 2022 was a decline in the macroeconomic condition. Recall, this was when inflation fears began, interest rates started rising, funding dried up for startups and tech layoffs began. A few Google searches led me to realize that all of these events began in the spring/summer (call it June 2022), shortly after our conversion decline started. After interviewing different members of the marketing and product teams, I realized that most of the customers who use our free trial are startups and small businesses, the same group most likely to be significantly impacted by these macro events.
Here’s an updated table with our findings:
Step 3: Putting it all together
After gathering clues and exploring hypotheses (a process that usually takes days/weeks - not the few short minutes it took you to read those paragraphs) it’s time to put it all together. The process I recommend is returning to your investigation document and writing an executive summary. This can then be copied into email / slack and distributed along with a link to your doc. I also try to help people visualize the analysis.
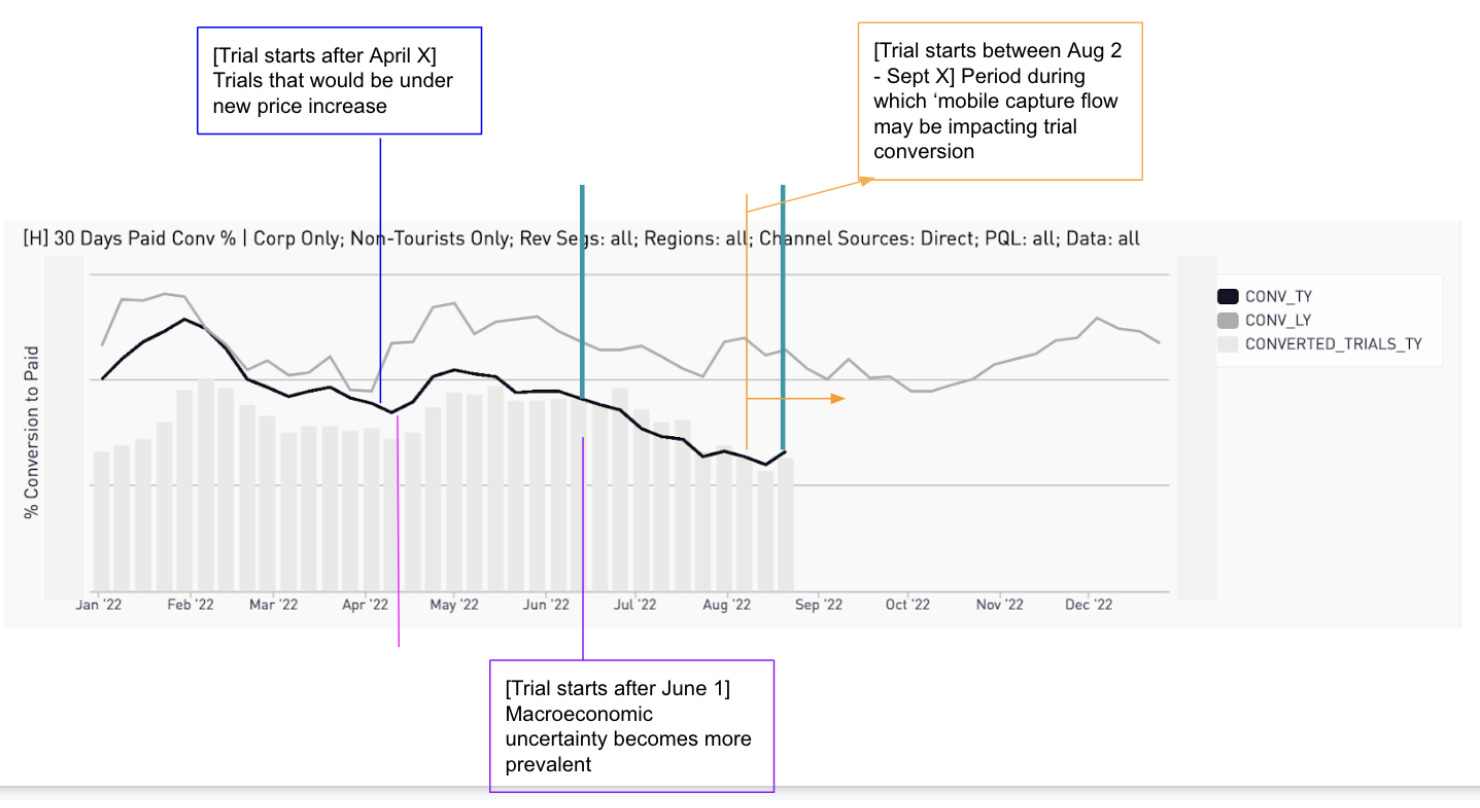
In the case of our conversion rate decline, I had 3 clues I was able to graph on our conversion rate chart:
April price increase
June macroeconomic decline
August onboarding flow product change that reduced the % of customers who triggered an incident
Conclusion
Once you’ve gathered the data, explored hypotheses, and connected the dots, it’s time to act. In the case of PagerDuty’s conversion rate issue, we identified three key factors: a price increase, a macroeconomic downturn, and a product change that made a critical user action harder.
After identifying the root causes, the next steps were clear. My team focused on improving the onboarding flow and test incident trigger, while the marketing team adjusted targeting strategies to account for the macroeconomic impact on our startup customer base. Cross-functionally we also began reviewing our pricing strategies.
Root cause analysis isn’t just about identifying problems—it’s about creating action plans that can be implemented across teams. Through thorough investigation, collaboration, and experimentation, you can not only identify the cause of a metric decline but also drive targeted improvements to address it.
Steps to Conducting a Root Cause Analysis:
Gather Context: Understand the problem by asking key questions and gathering relevant data.
Explore Hypotheses: Brainstorm possible causes, categorizing them into internal, external, and technical factors.
Dig Into the Data: Analyze data to validate or eliminate hypotheses, looking for patterns or anomalies.
Validate External Factors: Consider market or environmental factors that could influence the metric.
Put It All Together: Summarize findings, visualize key data points, and present actionable recommendations.